
Data Science and Diversity in Libraries
Measuring diversity in library collections using data science methods. Includes a supporting research paper and interactive visualization tools for collection analysis and social network approaches to libraries.

Stolen Treasures — Ukrainian Cultural Artifacts
Interactive bilingual visualization of Ukrainian archaeological artifacts and cultural heritage objects held in Russian museums, including the State Historical Museum and the Hermitage.

Old Toronto Historical Itinerary Planner
Interactive walking tour planner drawing on 37,000+ archival photographs. Explore Toronto's history through era-based routes, density maps, and archival image slideshows.

BiblioSwap — Ukrainian Canadian Book Lending
Bilingual (English/Ukrainian) peer-to-peer platform for sharing and lending Ukrainian-language books within the Canadian diaspora. Search, borrow, and connect with readers nearby.

Rare Books Catalog — Metadata Standards & IIIF
Cataloging system for rare books and incunabula applying metadata standards including MARC, Dublin Core, and IIIF. Features OCR, creator authority records, and structured metadata for historical and archival collections.
Urban Segregation & Library Access
Social network analysis of 87M geolocated interactions reveals how wealth shapes movement and connection across cities — rich connecting to rich, poor to poor. A new lens for understanding community access to libraries and public services beyond static demographic data.
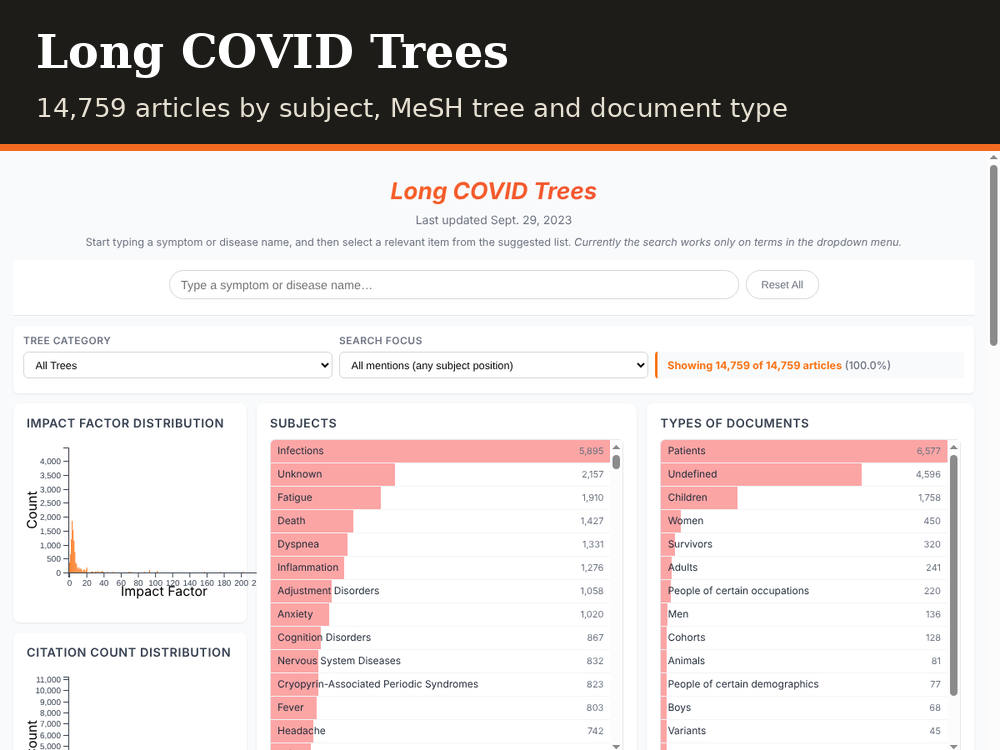
Long COVID Trees — Literature Explorer
Explorer for 14,759 Long COVID articles. Search by symptom or disease, filter by tree category and subject position, and see subjects, document types, impact factors and citation counts (data as of September 2023).
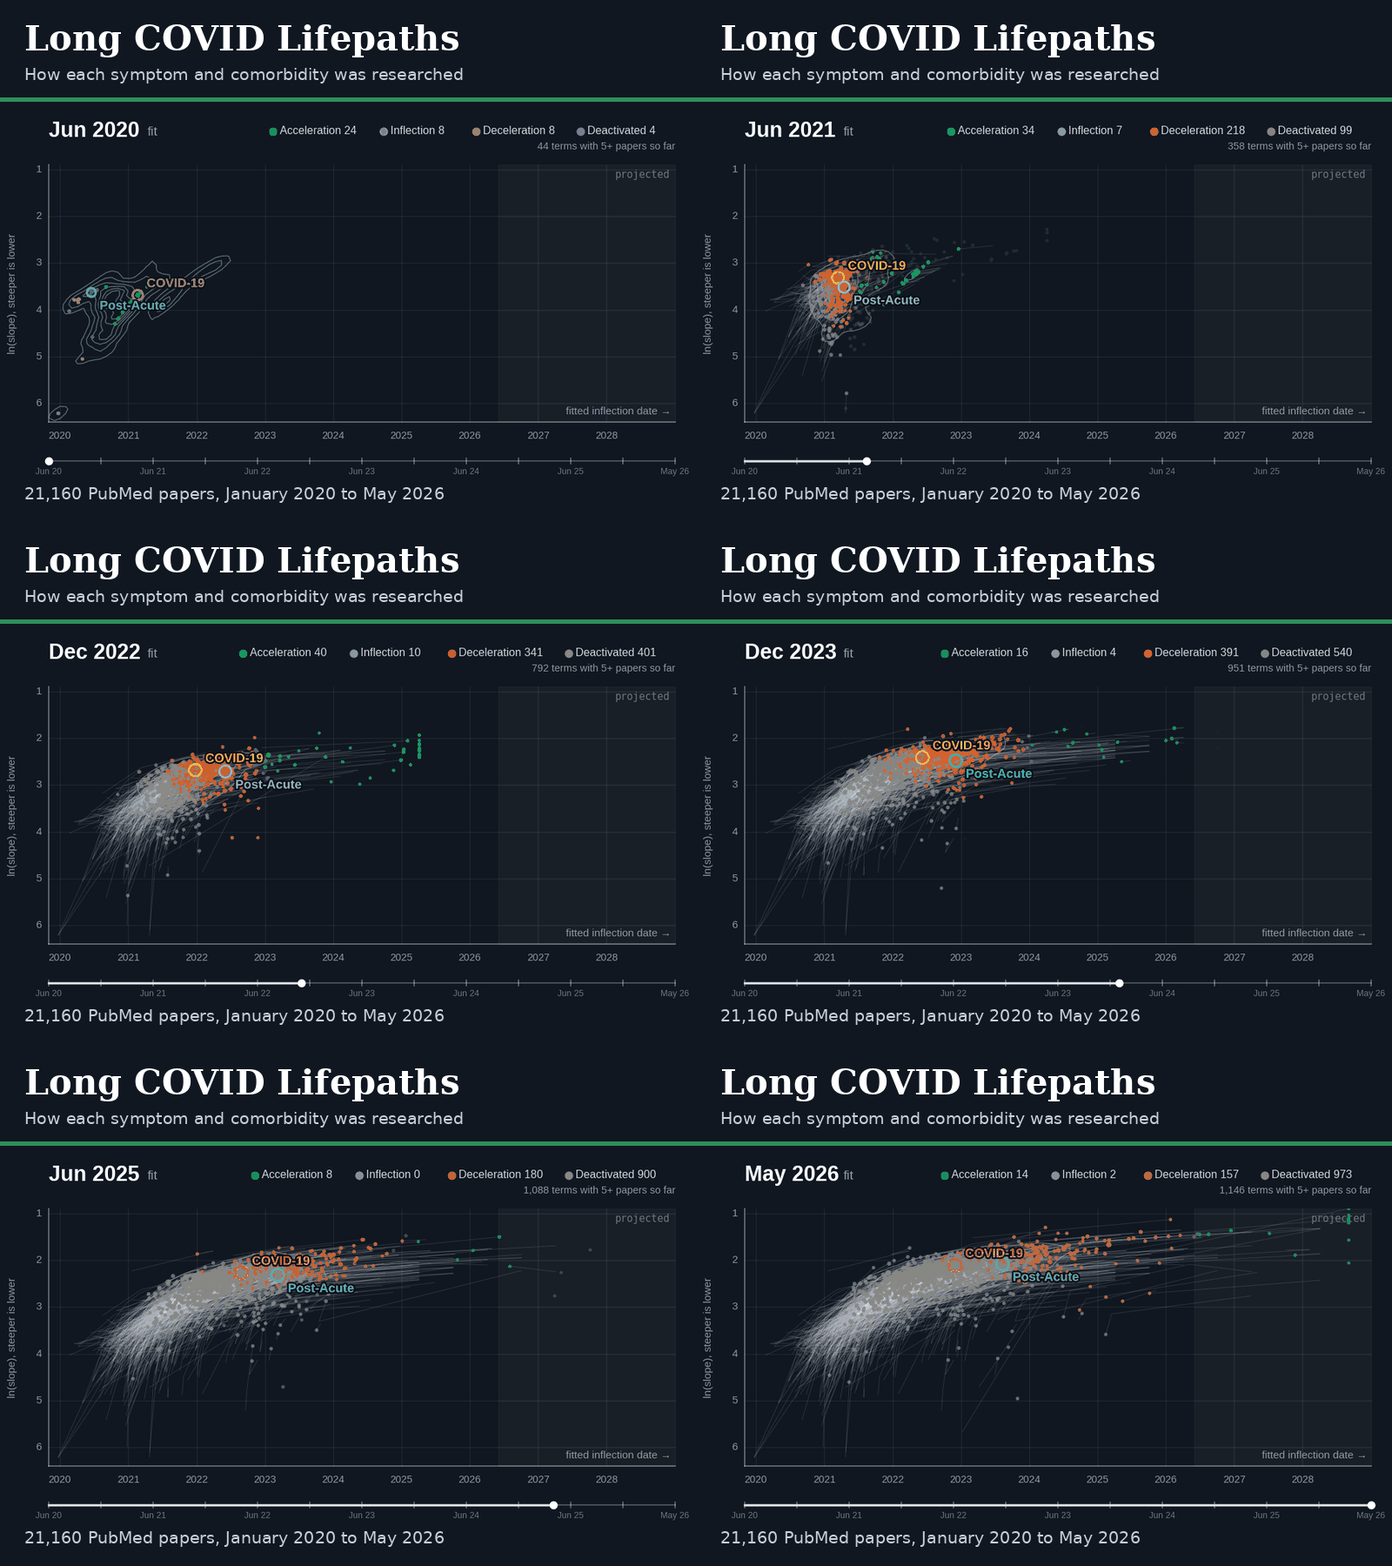
Long COVID Lifepaths — Symptoms & Comorbidities
How research on each symptom and comorbidity of Long COVID rose and levelled off across 21,160 PubMed publications (January 2020 to May 2026). Each term is classed as acceleration, inflection, deceleration or deactivation using sigmoid-parameterized lifepaths.
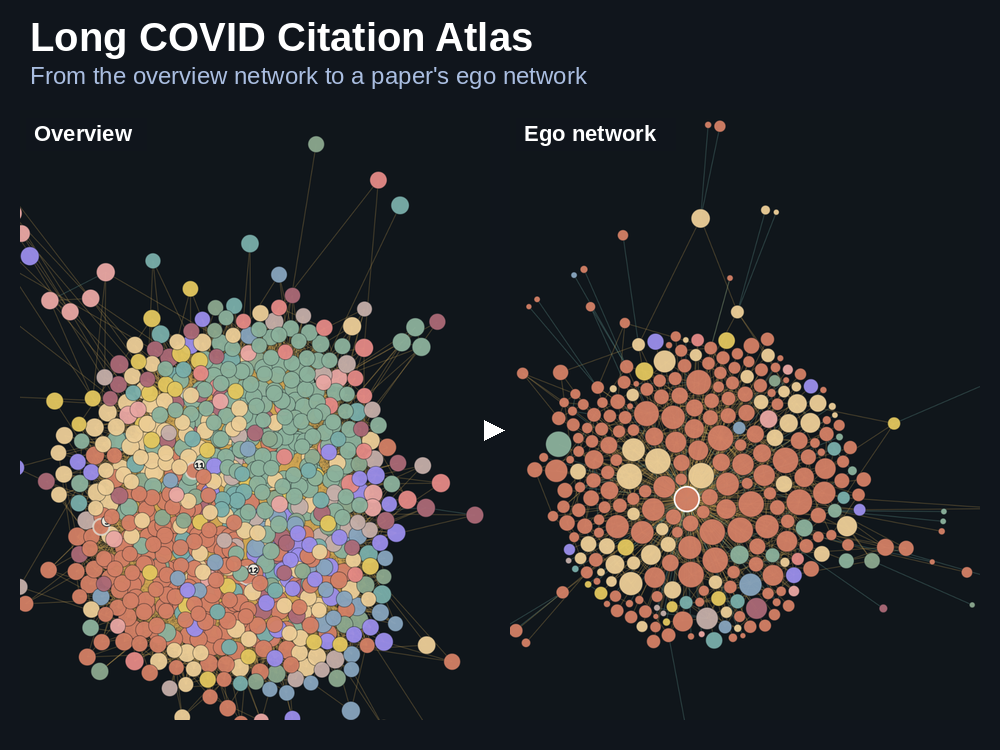
Long COVID Citation Atlas
Reference and citation lineage across 286,342 Long COVID papers. Start from an overview of the most connected papers grouped into literature clusters, then open any paper to see its ego network: what it cites and what has cited it since.
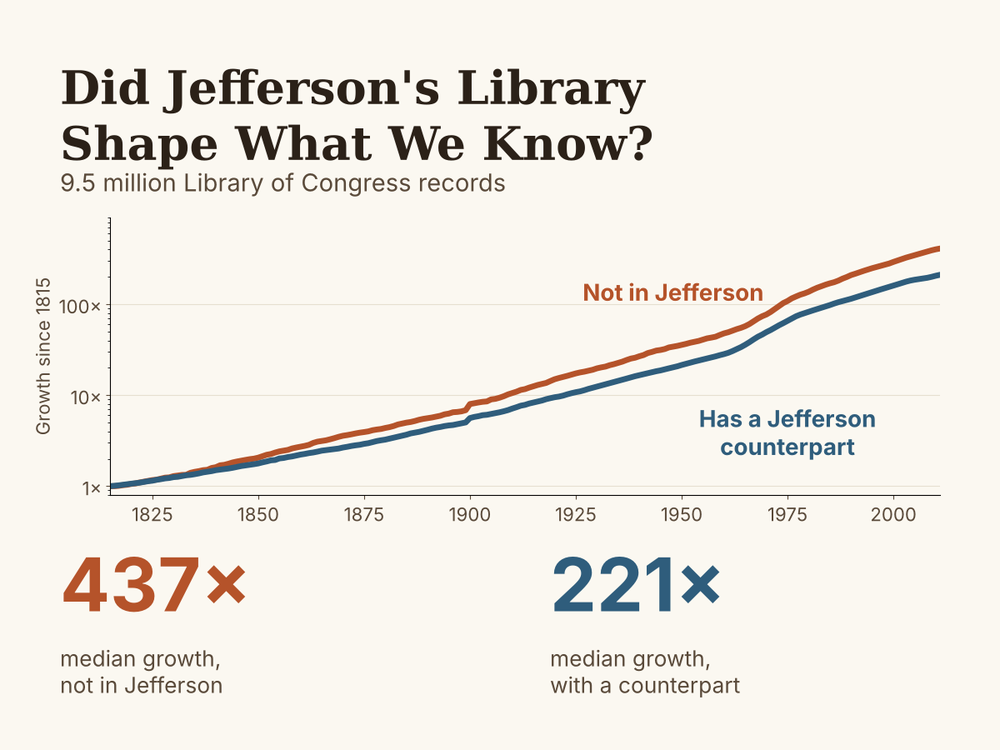
Did Jefferson's Library Shape What We Know?
Interactive analysis of 9.5 million Library of Congress catalog records testing whether Jefferson's 1815 classification left a trace in how the catalog grew. Subclasses absent from his scheme grew more and peaked later.
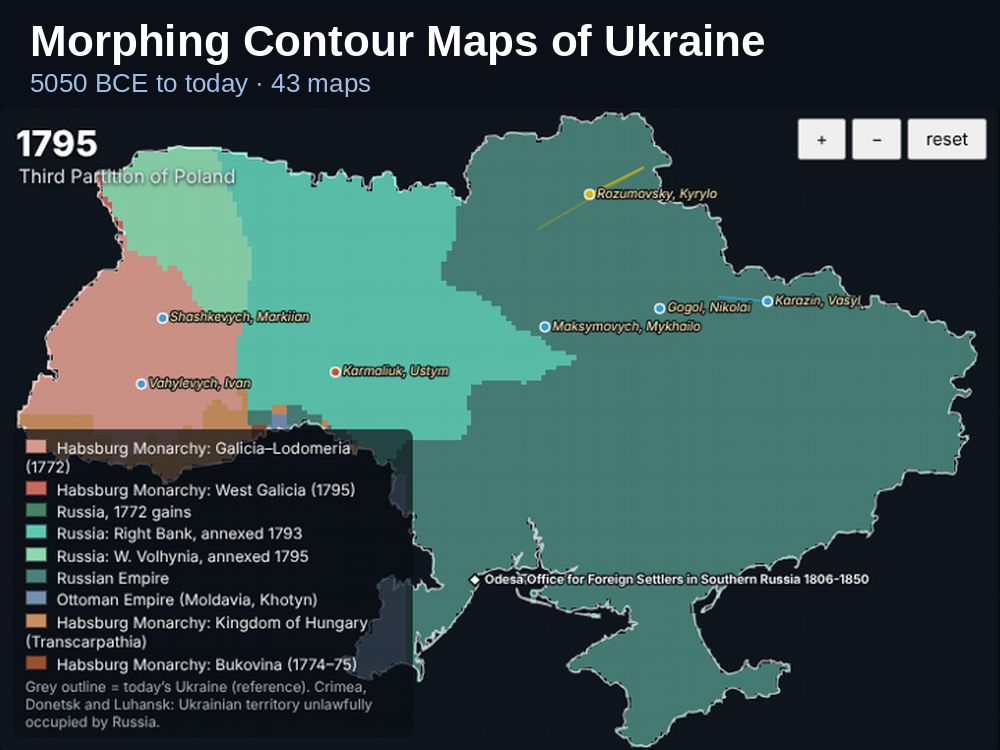
Morphing Contour Maps of Ukraine — VICOLEX
Animated historical maps of Ukraine’s lands from 5050 BCE to today. Regions slide from one map to the next across 43 maps, with the events, people and library-catalog records linked to each period. Crimea, Donetsk and Luhansk are shown as Ukrainian territory unlawfully occupied by Russia.
Stolen Treasures — Methods Note
Temporal visualization methodology for tracking cultural heritage data over time. Covers data sources, algorithms, temporal analysis approaches, and validation for the Stolen Treasures project.
Information Visualization of Library Collections
Long-form article on infovis and information visualization for library collections, linking IEEE infovis, visual analytics, digital heritage, and collection interface design.