Data Science
and Diversity in Libraries

Data Science
and Diversity in Libraries
Data Science
and Diversity in Libraries
This website complements our articles in Library Trends Vol. 71, No. 2, 2022.
[1] Coleman, A. (2022). International Contexts and US Trends in Equity, Diversity, Inclusion, and Accessibility in Libraries. Library Trends. Vol. 71, No. 2, pp. 254-283.
[2] Buchel, O., Coleman, A. (2022). Statistical Essay on Diversity in the Library Professions Compared to Other Occupations in the United States of America. Library Trends. Vol. 71, No. 2, pp. 303-337.
Library managers and researchers need to consider diversity dimensions beyond just race and gender for understanding and increasing diversity in libraries (Coleman, 2022). Data science based on statistical reasoning and complexity science improves the validity, reliability, and applicability of diversity research and management in libraries (Buchel and Coleman 2022).
Library literature on diversity often uses race, ethnicity, and employment data from the U.S. Census Bureau or Bureau of Labor Statistics. This data is often cited or copied without considering other occupations, population differences like age, income, education, disabilities, foreign born, technology access, geographic regions, and temporal aspects. Averages and percentages provide an illusion of evidence and rationality. They hinder insights about relationships, patterns, and trends.
Our study Buchel and Coleman (2022) used U.S. occupational data to explore diversity questions. How does the racial/ethnic composition of library occupations compare to other occupations? What are the relationships and associations between library occupation racial/ethnic compositions and all other occupations? We considered annual averages from the Current Population Survey, using "Employed persons by industry, sex, race, ethnicity" for diversity, k-means, and PCA calculations.
This website presents additional interactive visualizations showing library occupation diversity scores and variances compared to other occupations. These plots complement the analysis in [2].
Why do we Need Data Science in Libraries? Management decisions in libraries are often based on best practices, statistical averages or percentages, or qualitative evidence, not more rigorous data science. Statistical averages and percentages create only an illusion of rationality. They lack deeper insights about variances in data, and mask underlying fundamental differences.
On this companion website, we provide interactive visualizations and data tables for comparing diversity scores and variances within library occupations to those in other fields. We have adapted 354 occupation names and industry categories. These are sourced from the Bureau of Census for the Bureau of Labor Statistics site, with a few exceptions, particularly for those with low counts. This analysis utilizes data from the survey conducted in 2021, where we apply "Employed persons by detailed industry, sex, race, and Hispanic or Latino ethnicity" for diversity, k-means, and PCA calculations. It's important to note that the website currently displays data from 2023, offering an up-to-date perspective on these metrics.This comparative exploration serves as a valuable source of additional visualization that complement the analyses in [2].
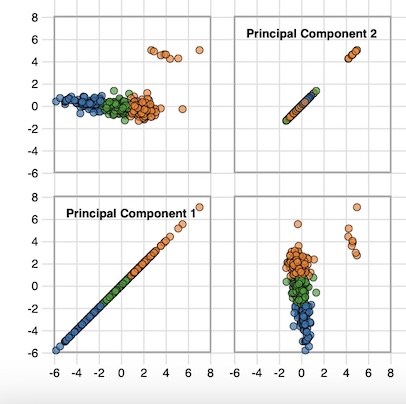
PCA and K-Means analysis of occupations listed in the Current Population Survey conducted by the Bureau of Census for the Bureau of Labor Statistics.
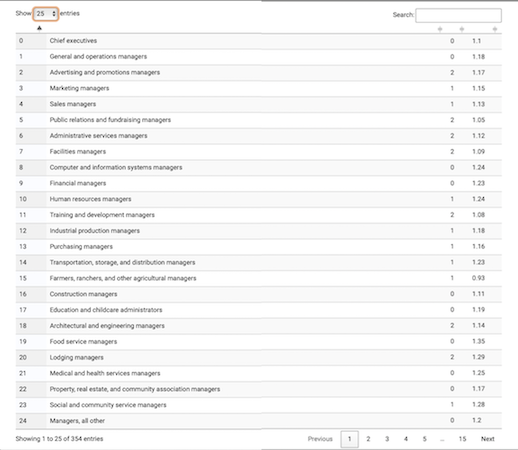
Diversity scores in occupations.